Low Inventory Once Again Spurs Increased Competition for Homes in the GTA
February 2023 Greater Toronto Area Market Statistics
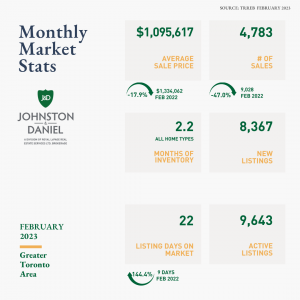
During the month of February, the housing market in the Greater Toronto Area (GTA) experienced a noticeable revival, characterized by a surge in property values across all asset classes. Notably, the average sales price for all property types increased by 5.4% when juxtaposed with January’s data, culminating in a February average sales price of $1,095,617.
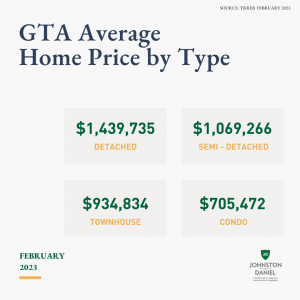
The gains in property values were observed across all asset classes, with the detached market realizing an impressive uptick of 7.2%, resulting in an average sales price of $1,439,735, the largest increase since January 2022. Similarly, the condominium market increased month-over-month with an appreciation of 2.5%, translating into a final average sales price of $705,472 for the month of February. Pressure on inventory led to a substantial drop in average days on market which now sits at 22 days, the lowest since August 2022.
Market activity also increased, as evidenced by a substantial improvement in both sales and inventory in comparison to January. The number of properties sold reached its highest level since November 2022, with 4,783 homes changing hands. Concurrently, inventory levels continued to rise, with 9,643 active listings across the GTA’s housing market. That said, transactions continue to lag as compared to the level of activity we have seen over the past several years. As fewer homes change hands, demand from those who in the medium-term anticipate participating in the housing market continues to build.
The positive February data bodes well for the rest of 2023 and beyond, indicating the return of stability and significant demand that will propel the market higher as consumer confidence continues to rise. As we move into the spring, more inventory will be welcomed by eager buyers who have been stymied by an ultra-low inventory environment.
“Views on real estate have consistently been a foundational element in consumer confidence,” said Nik Nanos, chief data scientist of Nanos Research. “Although not returning to the exuberant levels from a year ago when the housing market was red hot, the weekly tracking is seeing the beginnings of a potential positive trajectory.”
As the trajectory of the market moves in a positive direction and sale prices start to tick upward, we anticipate more sellers re-entering the GTA housing market in the coming weeks.
Pent-Up Demand for Homes Continues to Build
Eight successive interest rates hikes in the past year, while necessary to cool inflation, have created some unintended consequences which in the medium to long-term will put additional strain on the GTA’s already tight housing supply.
Buyers who are taking a wait-and-see approach will be faced with increased competition when they do return to the market.
Increased immigration, fewer than necessary building starts, changes to household formation trends, particularly among millennials, are building demand that will be unleashed on the housing market in the next few years.
“With the expectation that interest rates could fall in 2024, the short-term relief in house price inflation that big cities across Canada are experiencing right now is blinding policymakers to the medium-term crisis”, Phil Soper, President and CEO of Royal LePage recently shared with the Toronto Star.
The Toronto Regional Real Estate Board shares the same sentiment. “As we move toward a June mayoral by-election in Toronto, housing supply will once again be front and centre in the policy debate. New and innovative solutions, including the City of Toronto’s initiative to allow duplexes, triplexes and fourplexes in all neighbourhoods citywide, need to come to fruition if we are to achieve an adequate and diverse housing supply that will support record population growth in the years to come,” said TRREB Chief Executive Officer John DiMichele.

The average selling price was $1,095,617 as compared to $1,038,668 the previous month. The average price is below last year’s average of $1,334,062.
The average number of listing days on the market was 22, down from 29 in January 2023. Total active listings were up 38.1% year-over-year, and new listings were down 40.9% year-over-year, from 14,153 in February 2022 to 8,367 in February 2023.
Benchmark price by home type (all TRREB reporting areas):
- The benchmark price for detached homes was $1,385,000, 19.6% lower than in February 2022.
- The benchmark price for attached homes was $1,055,900, 18.7% lower than in February 2022.
- The benchmark price for townhouse homes was $796,400, 15.5% lower than in February 2022.
- The benchmark price for condo apartments was $695,000, 10.8% lower than in February 2022.
Average price by home type (416 and 905):
- The average price for detached homes was $1,439,735, 20% lower than in February 2022.
- The average price for semi-detached homes was $1,069,266, 21% lower than in February 2022.
- The average price for townhouse homes was $934,834, 17% lower than in February 2022.
- The average price for condo apartments was $705,472, 12% lower than in February 2022.


